
Johan Santana’s Trend Lines Are Depressing
 I’ve ripped on Francisco Rodriguez and his contract before, referencing his depressingly awful trend lines, showing that he’s only getting worse — while getting paid progressively more. Unfortunately, I can do practically the same thing for Johan Santana.
I love Johan. He’s been one of the few guys on this Mets team that I’ve never been truly disappointed in. And I’ll never forget that gem he threw in the second-to-last game of the 2008 season.
But: he’s signed to a massive contact through at least 2013, with a club option for 2014. Roy Halladay will be making less over the same period and at this point looks like he will easily be the superior pitcher over the next few years. I can’t get on Omar for the contract, but I really hope Johan can stop his decline and at least maintain his performance of the past two years. I’m just not sure that’s going to happen. Pedro Martinez was all but done being Pedro at 33. I see Johan as basically Pedro-lite, and he turns 33 in two years.
If you want to see pretty graphs detailing Johan’s decline since his epic 2004 season, hit the jump.

Striking out guys at a progressively lower rate is never good.

Walking guys at a progressively HIGHER rate is never good, either.
Combine the two and you get:
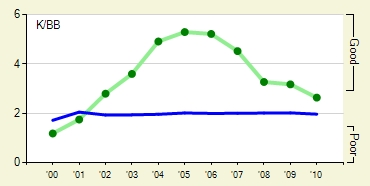
Well, that’s just bad. Shit.
Of course, when you strike out less guys, that means more guys are making contact. Hopefully those guys making contact aren’t making good contact.

I guess not. Now, pitchers don’t have much control over their BABIP, but they do have a bit. Johan is fooling batters just a tiny bit less each year.
So more guys are making contact, and that contact is apparently getting better (or the Mets’ fielding is just worse than the Twins’, which is very possible). That equals:

So far this 2010 — no thanks to that debacle on Sunday — batters are hitting him like he’s an average pitcher. Fuck.
So guys are hitting for a higher average off of him and also walking more. That can only mean one thing:

More and more baserunners.
Now, I don’t get why Fangraphs doesn’t have graphs for FIP and xFIP, and I could easily make graphs for them myself, but instead I’m just going to post his SIERA for the past 7 seasons in big bold digits. (SIERA being a superior metric for measuring future performance than xFIP.)
2004 – 2.38
2005 – 2.73
2006 – 2.74
2007 – 2.76
2008 – 3.61
2009 – 3.55
2010 – 3.80
He hasn’t been the same pitcher since he came to the Mets (and you can argue it started his last year with the Twins), but he’s done a damn good job of hiding that fact most of the time. It’s just the times where he gives up a grand slam to Felix Hernandez, or walks 71-year-old Jamie Moyer, that one can plainly see he’s past his peak.
All graphs courtesy of Fangraphs.
Related posts:


Pingback: Slumpbot .200: Johan Santana feels the effects of aging | Live Smart & Play Hard